Process Monitoring
Functionality
Service name in the microservices orchestration environment: qbpmcockpit
Example Swagger link: http://qbpmcockpit.****full namespace****/qbpmcockpit/swagger-ui/#/
Process Monitoring provides the following functions:
- Obtaining summary statistics on business processes executed in the system.
- Obtaining information about deviations from temporal regulations during the execution of business processes.
- Viewing summary information about incidents that have occurred and detailed information about an incident during the execution of business processes.
- Obtaining a list of all published business processes.
- Viewing detailed information about the progress of the execution of a business process.
- Test launch of business processes with input parameters.
- Obtaining a list of all published business rules.
- Viewing detailed information about executed business rules (decision-making models).
- Migration of business processes.
To work with the "Monitoring" module, you need to log in to the Digital Q.BPM platform under a user with the corresponding role.
In the main menu, the user has access to the "Process Monitoring" section. This section includes subsections corresponding to the functionality described above. When selecting a subsection, a form with relevant information will open.
Processes
Business Processes
The interface of business processes provides the ability to view a summary list of published business processes. The list of business processes can be filtered (by process name and execution service) and sorted.
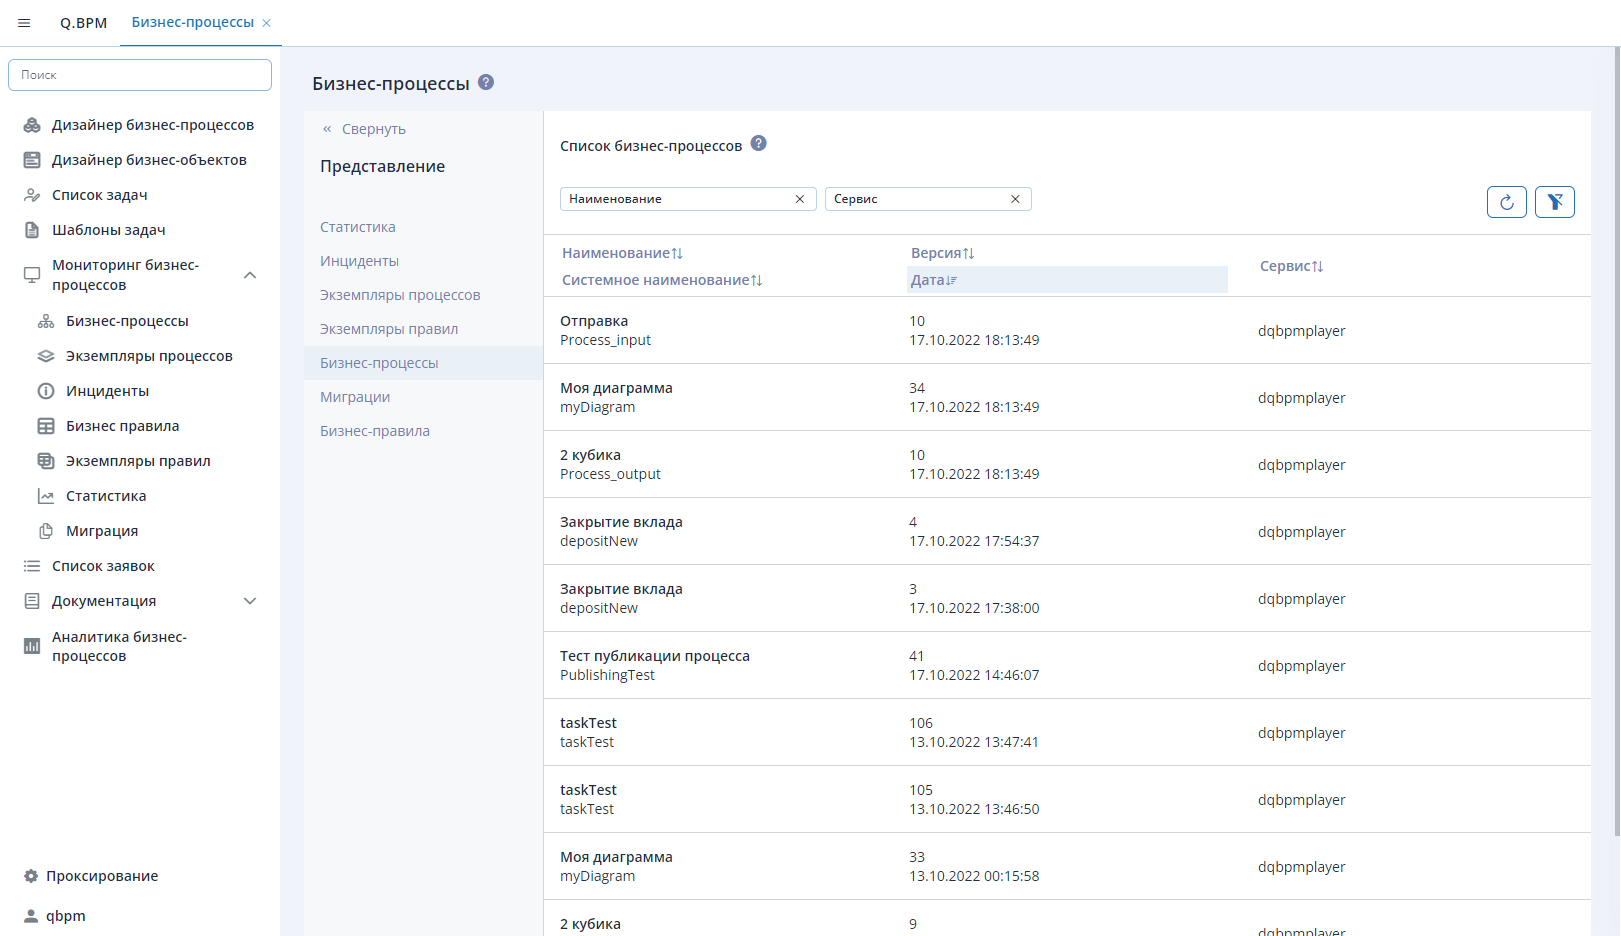
Selecting a business process from the list will take you to a detailed view of the published business process.
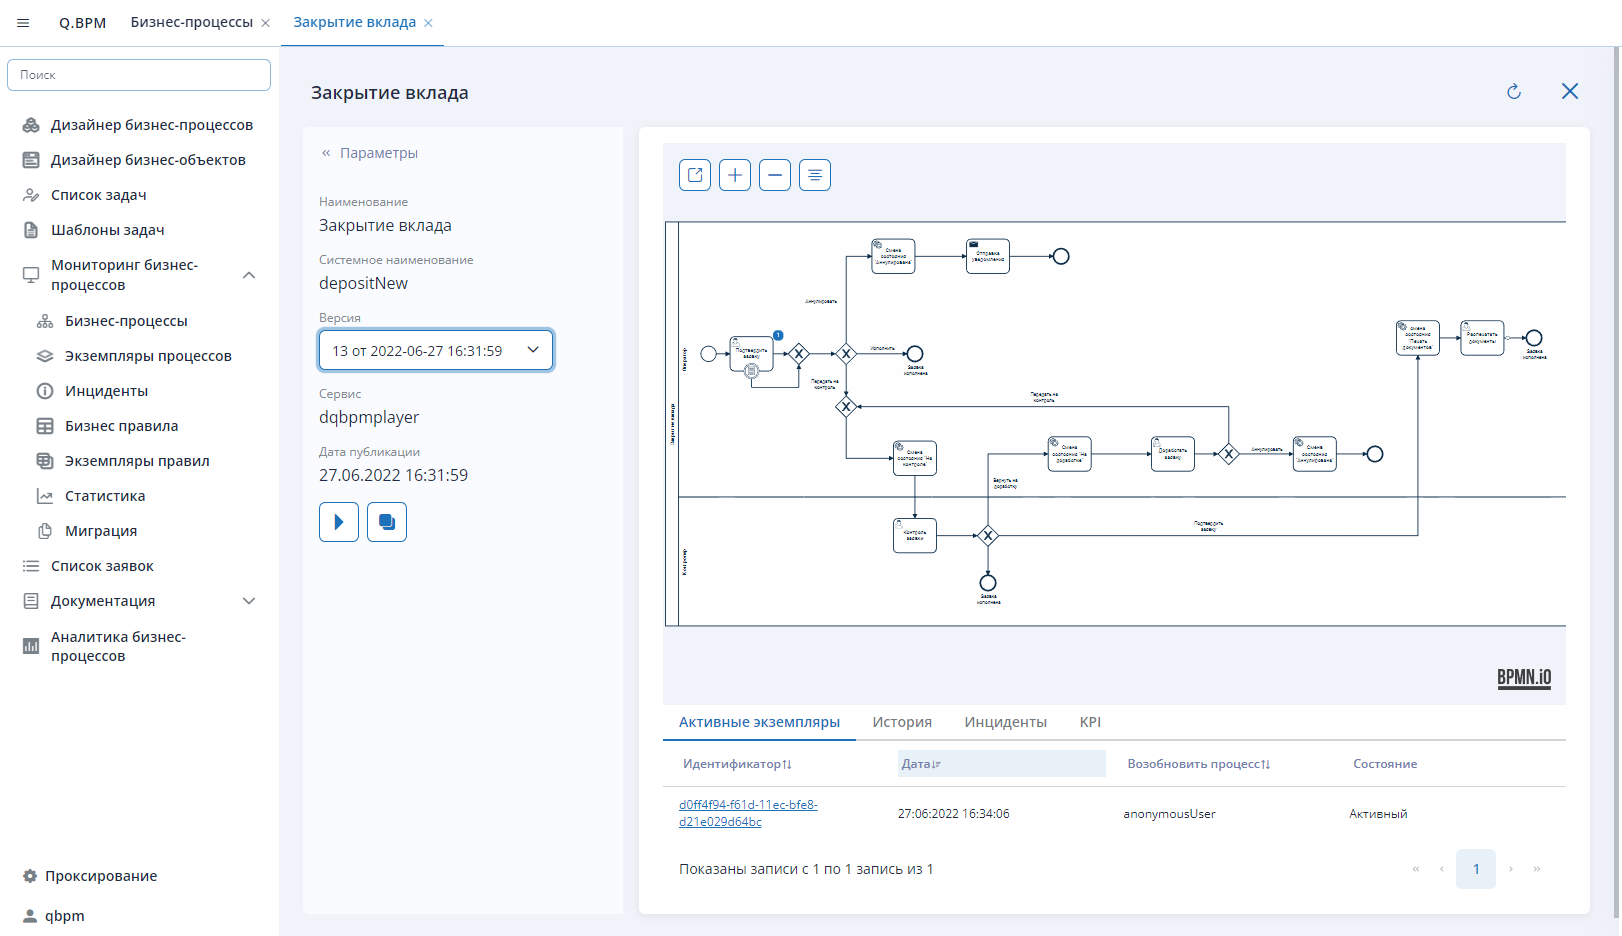
The detailed information form provides the user with the following information/options:
- Left sidebar with brief information about the business process:
- Brief information about the business process;
- Version - switching between different versions to view the diagram. The information in the sidebar and the architecture of the diagram correspond to the selected version;
- "Start Process" button - launches an instance of the business process with input parameters in a modal window. It can be used for testing the execution of the process version with different input parameters.
- Migration - migrates the current version of the diagram to any other version of the diagram.
- At the bottom of the form, a table displays summary information about the business process and instances:
- Active instances - unfinished instances of the version of the business process displayed on the form. Clicking on the instance identifier will redirect to a form to view detailed information about the progress of the business process instance;
- History - completed instances of the version of the business process. Clicking on the instance identifier also allows you to view detailed information about the progress of the instance;
- Incidents - incidents of the version of the business process;
- KPI - established KPIs for the version of the business process. KPIs can be set for both the process pool and individual steps.
Process Instances
The process instances interface provides the ability to view a summary of executed or executing versions of business processes. The list of process instances can be filtered and sorted.
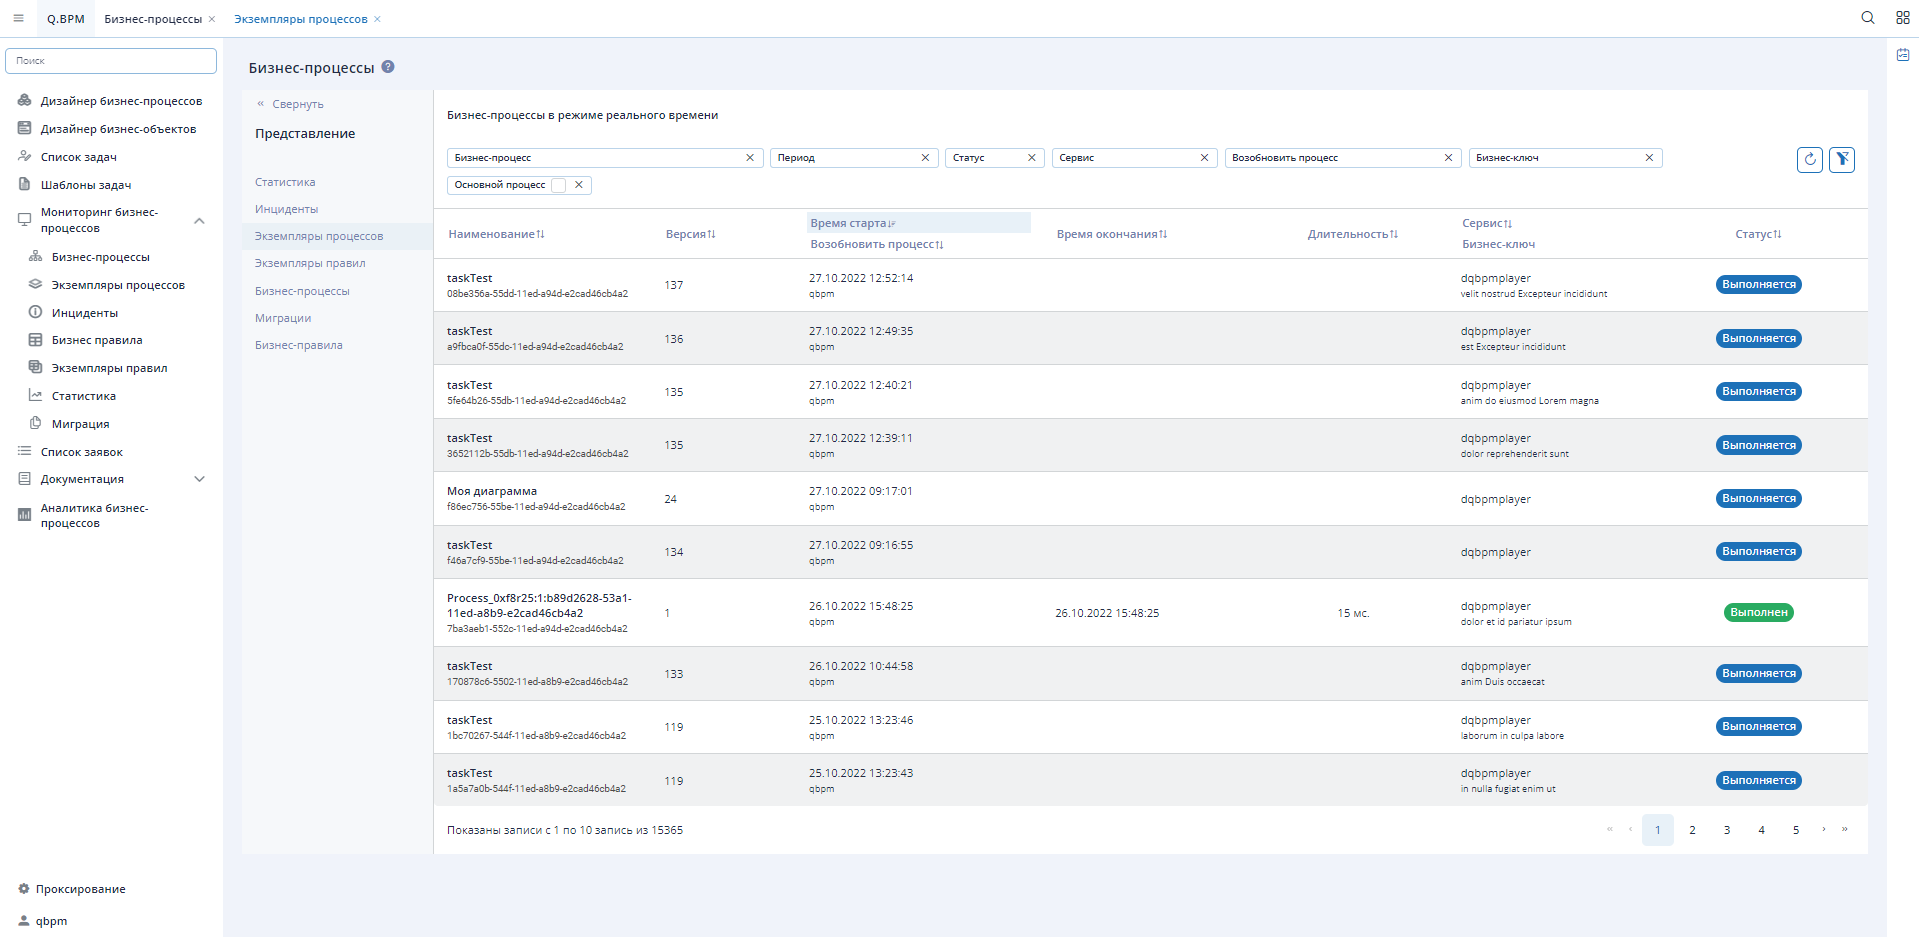
Selecting a process instance from the list will take you to a detailed view of the published business process.
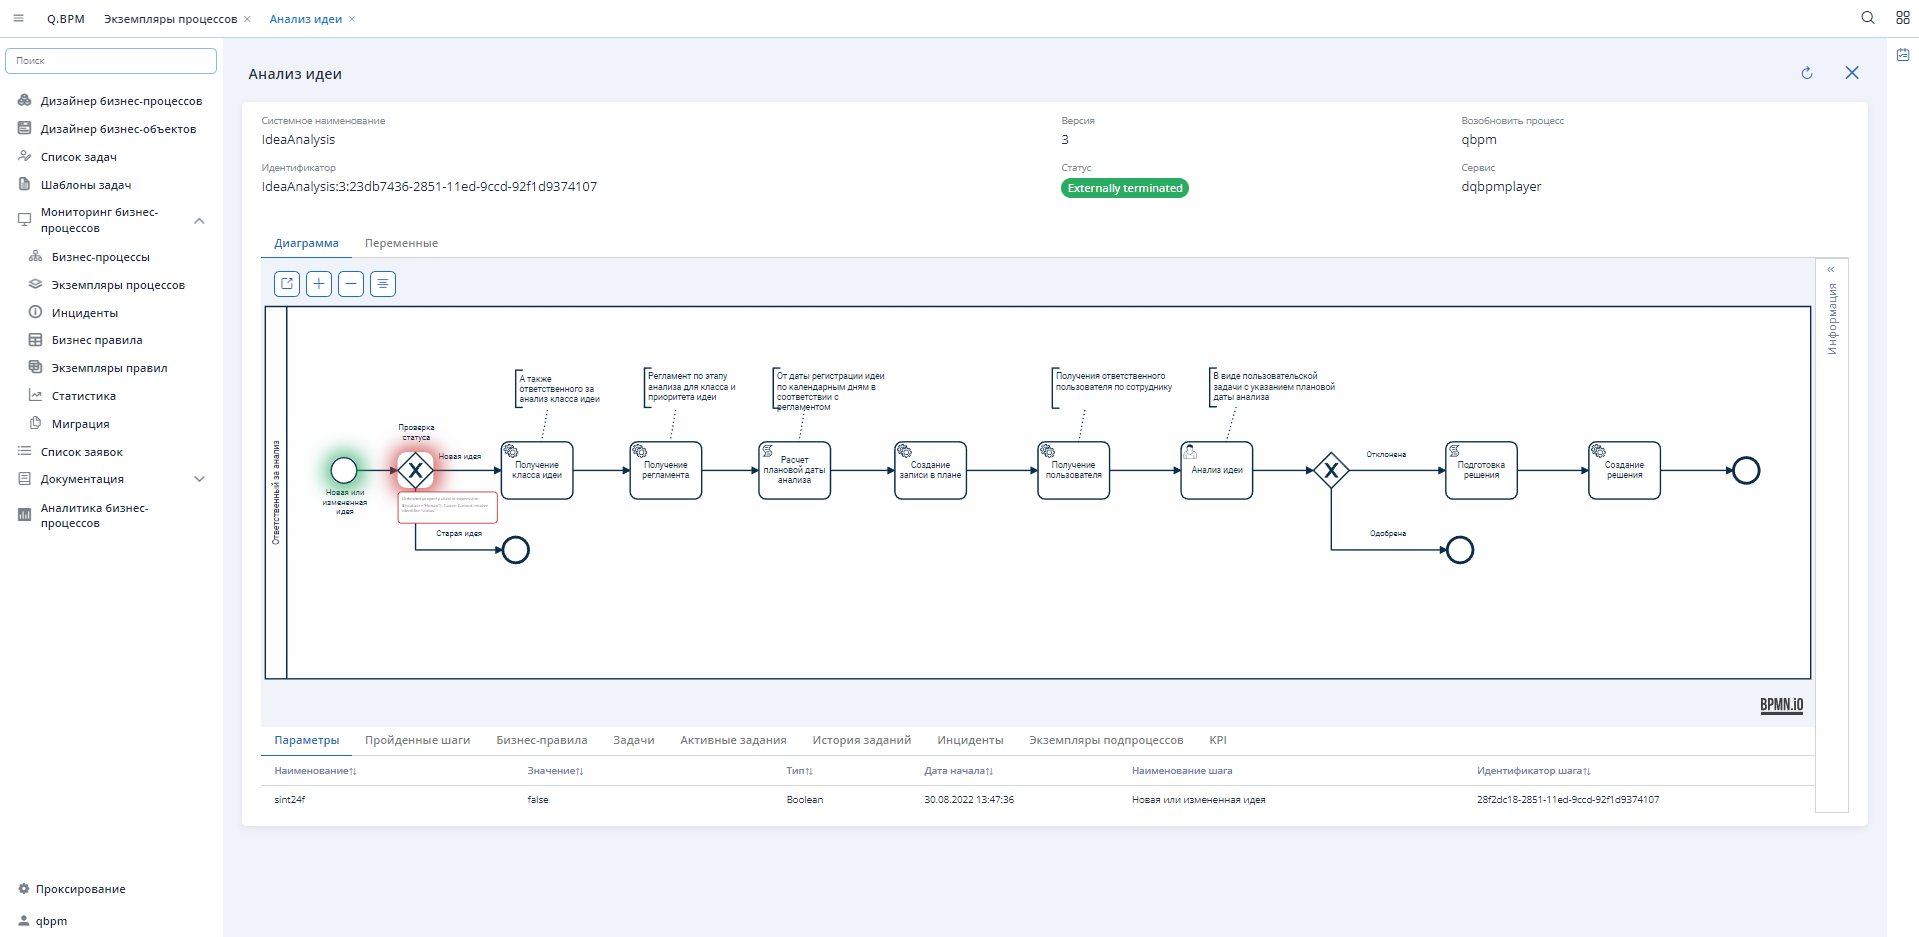
The process instance form provides complete information about the process and its execution. In the center of the form, there is a graphical representation of the process execution. The execution path of the process is highlighted in green, steps with errors are highlighted in red, and the error description is provided. From the visual representation of the diagram, you can switch to the "Variables" tab located at the top. This tab displays a list of all context variables of the running process, variable values, their type, and information about the process step associated with them.
In the right "Information" side panel, information about the process instance launch and execution is presented:
- Launch identifier;
- Identifier of the first step in the launch;
- Identifier of the last step in the launch;
- Start time;
- End time;
- Execution duration (ms);
- Status of the process instance execution.
When selecting a process step in the central part of the form, the displayed information in the "Information" side panel and the "Element" tab changes, as well as the information in the table at the bottom of the form.
The bottom of the form features a table with multiple tabs and all the information about the process instance execution:
- Parameters - description, parameter values, and their affiliation to the process step;
- Executed Steps - summary information on the execution of business process steps;
- Business Rules - summary information about executed instances of business rules in the process and the ability to navigate to them;
- Tasks - summary information about created and completed user tasks;
- Active Tasks - a list of unhandled errors;
- Task History - a list of error retries;
- Incidents - a problem that occurred during the execution of the process instance and was not fixed/passed during retries;
- Subprocess Instances - summary information about subprocess instances. You can navigate to subprocess instances and view summary information about them;
- KPI - display of metrics for the process instance and its steps, as well as summary information on execution or exceeding them.
Rules
Business Rules
The interface of business rules provides the ability to view a summary list of published business rules. The list of business processes can be filtered (by name, version, execution date, and execution service) and sorted.
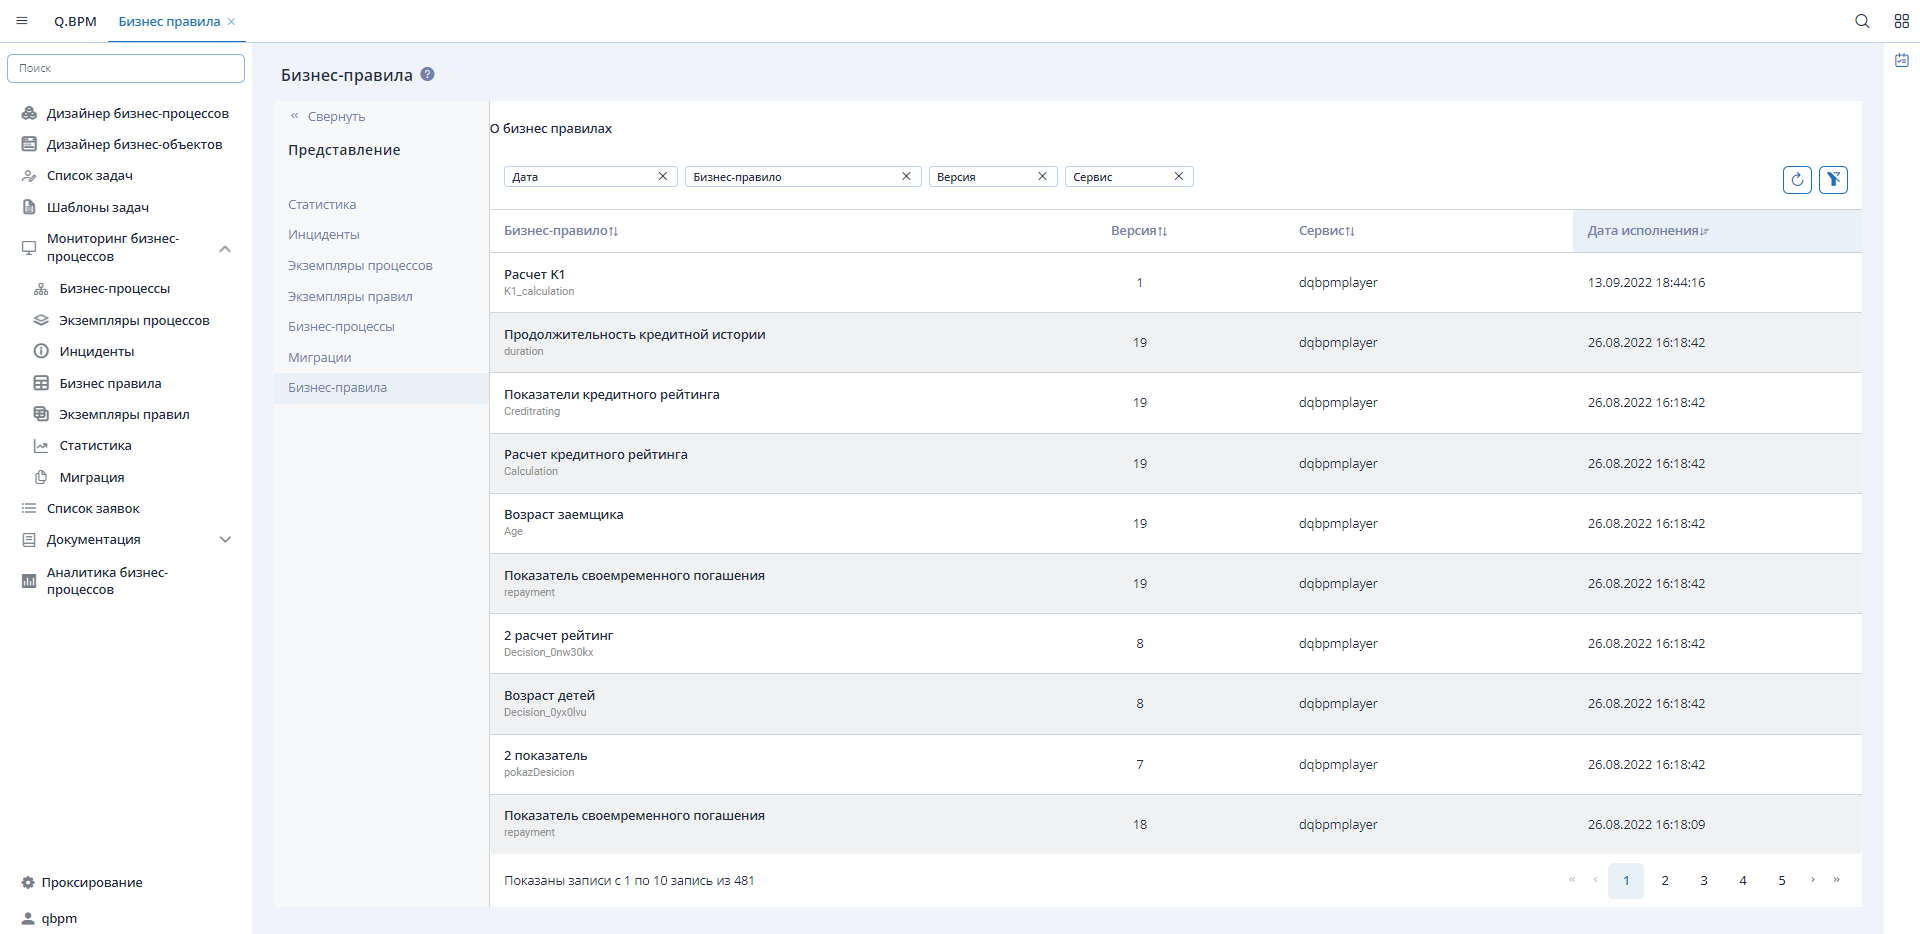
Selecting a business rule from the list will take you to a detailed view of the published business rule.
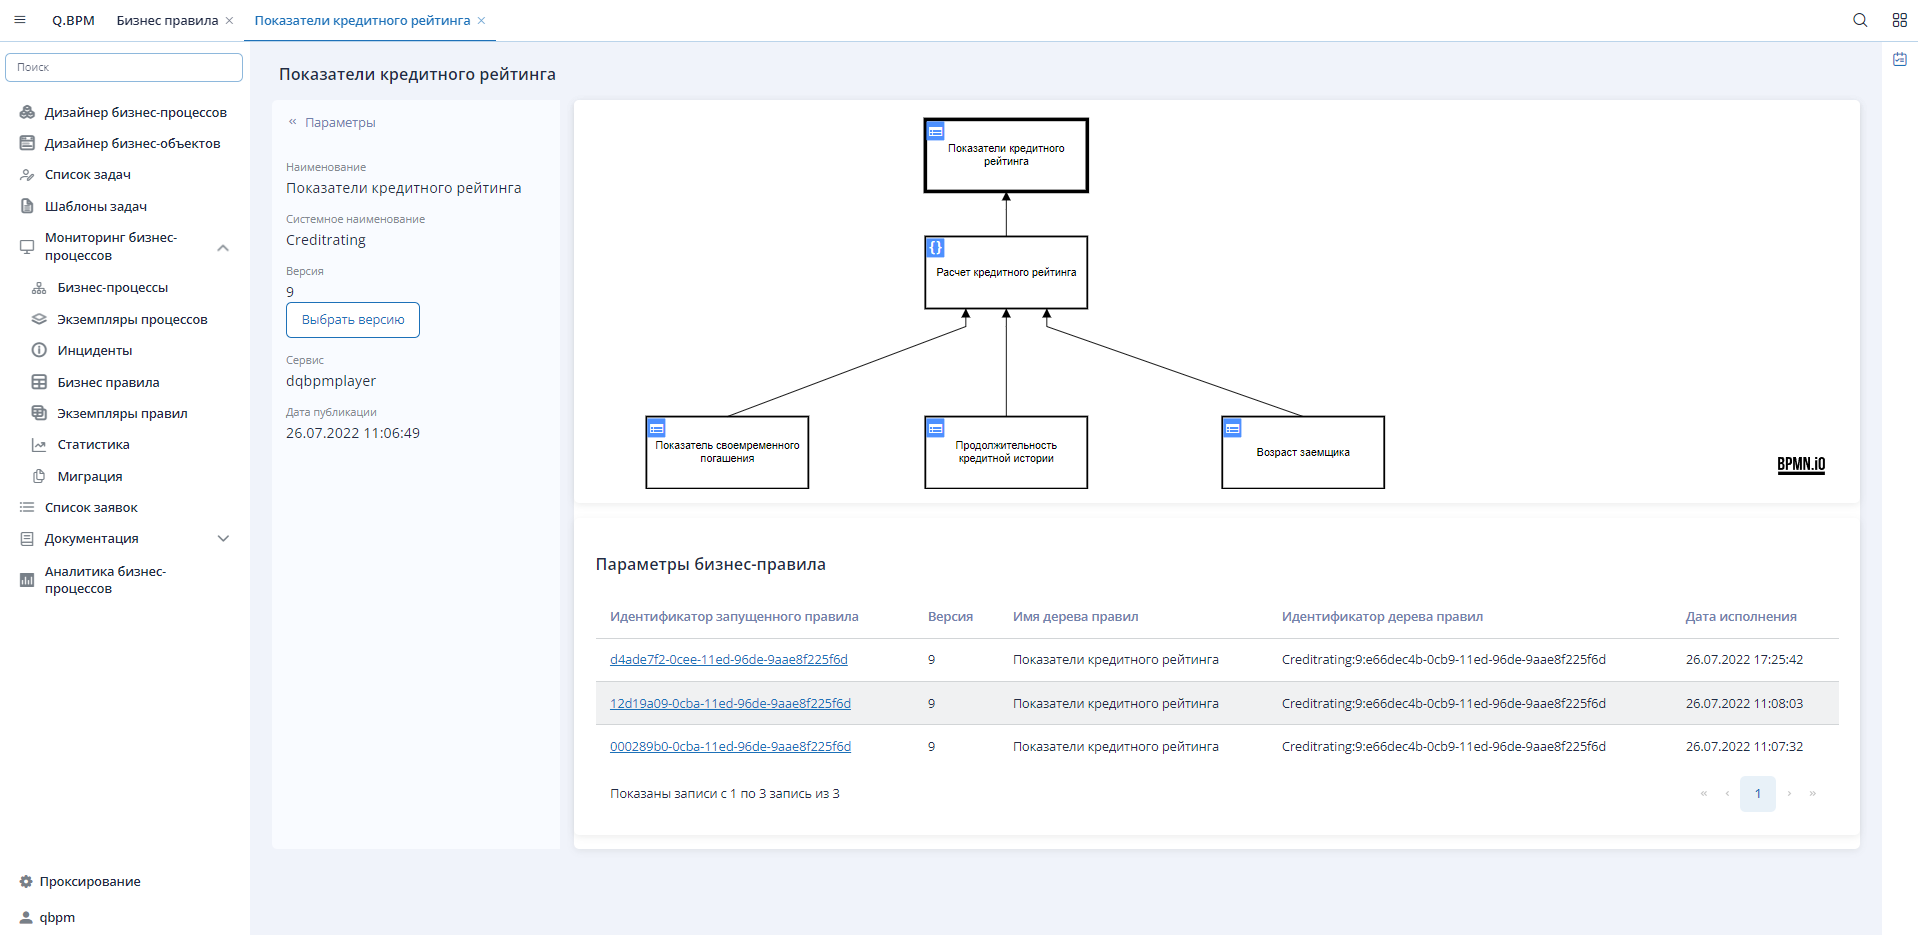
On the detailed information form, the user is provided with the following information/options:
- Left sidebar with brief information about the business rule:
- Brief information about the business rule;
- Version - switching between different versions to view the diagram. The information in the sidebar and the architecture of the diagram correspond to the selected version.
- A table with a list of all launched instances of the business rule version is displayed at the bottom of the form. Clicking on the identifier of the launched business rule will open a form to view detailed information about the executed decision tree instance.
Rule Instances
The interface of rule instances provides the ability to view a summary list of executed or executing versions of business rules. The list of rule instances can be filtered and sorted. An important note: there is a filter available for the "Main Rule of the Tree," which allows displaying in the list the main invoked rule that has and had executed dependent rules.
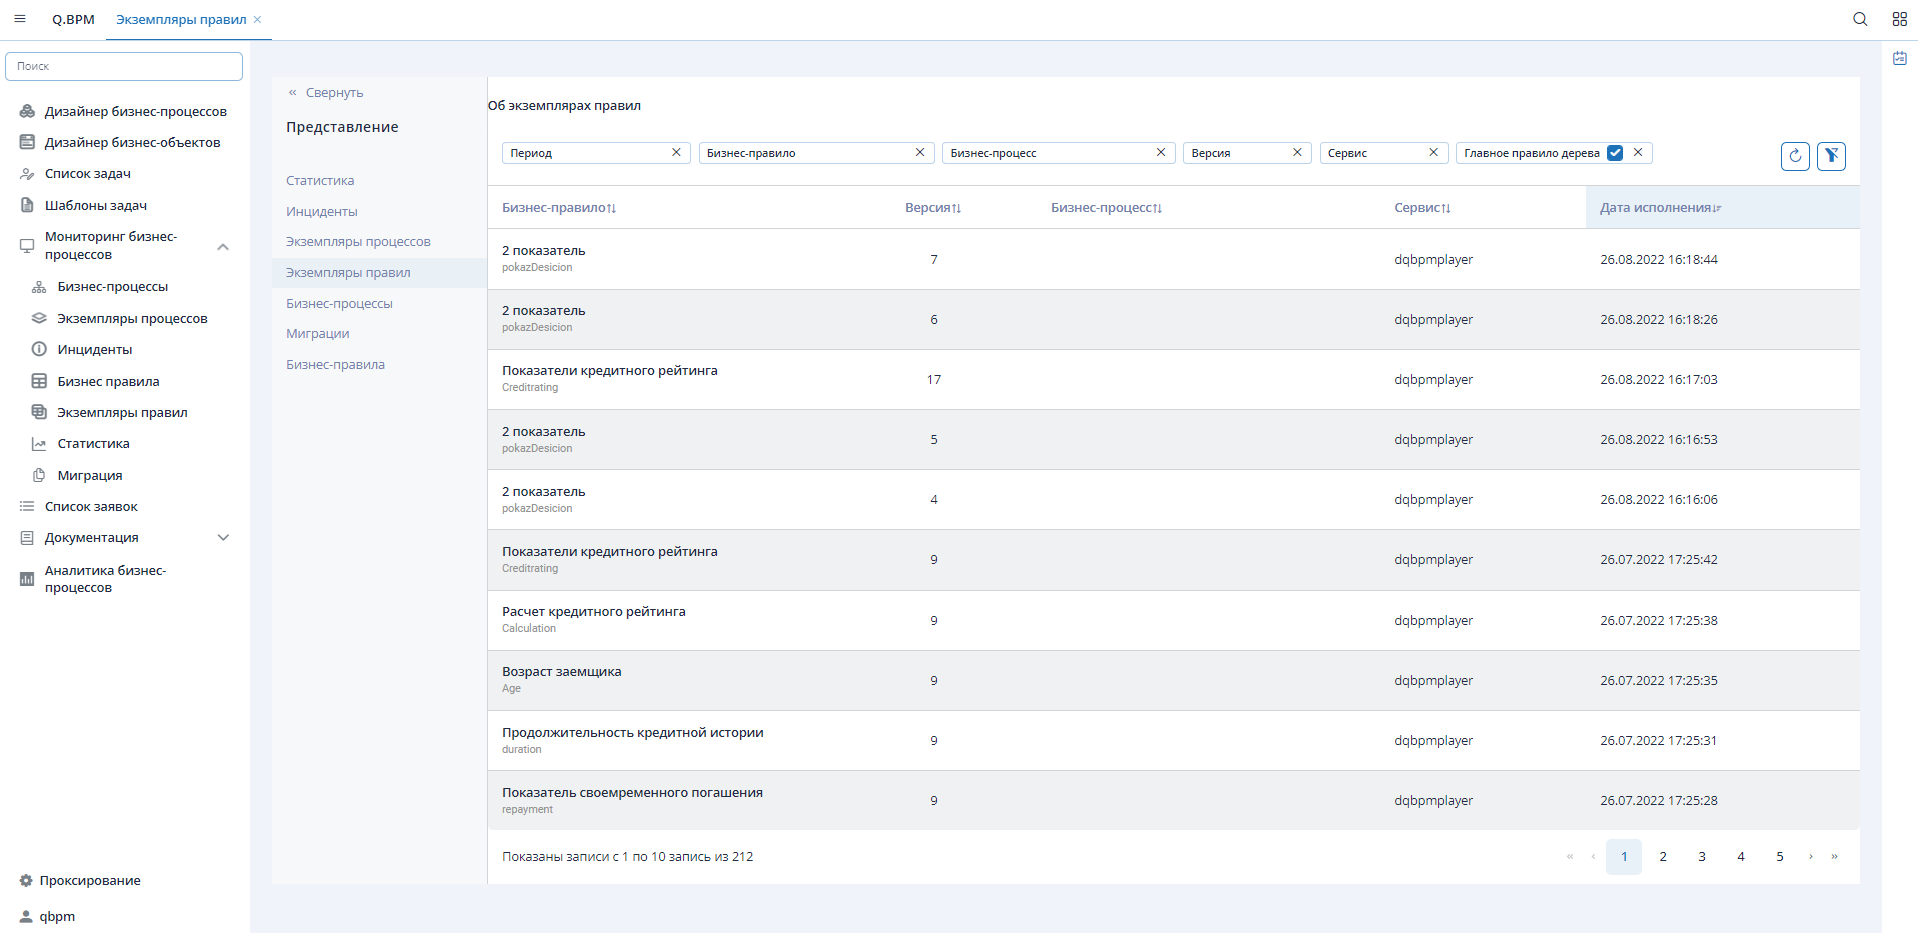
Selecting a rule instance from the list will take you to a form to view detailed information about the executed instance of the business rule. The form will display a visual representation of the instance of the business rule version, highlighting the conditions that have been met (or showing the script in the case of a Literal Expression rule) for this rule and/or the result. At the bottom of the form, there is a table with incoming and outgoing variables and their values.
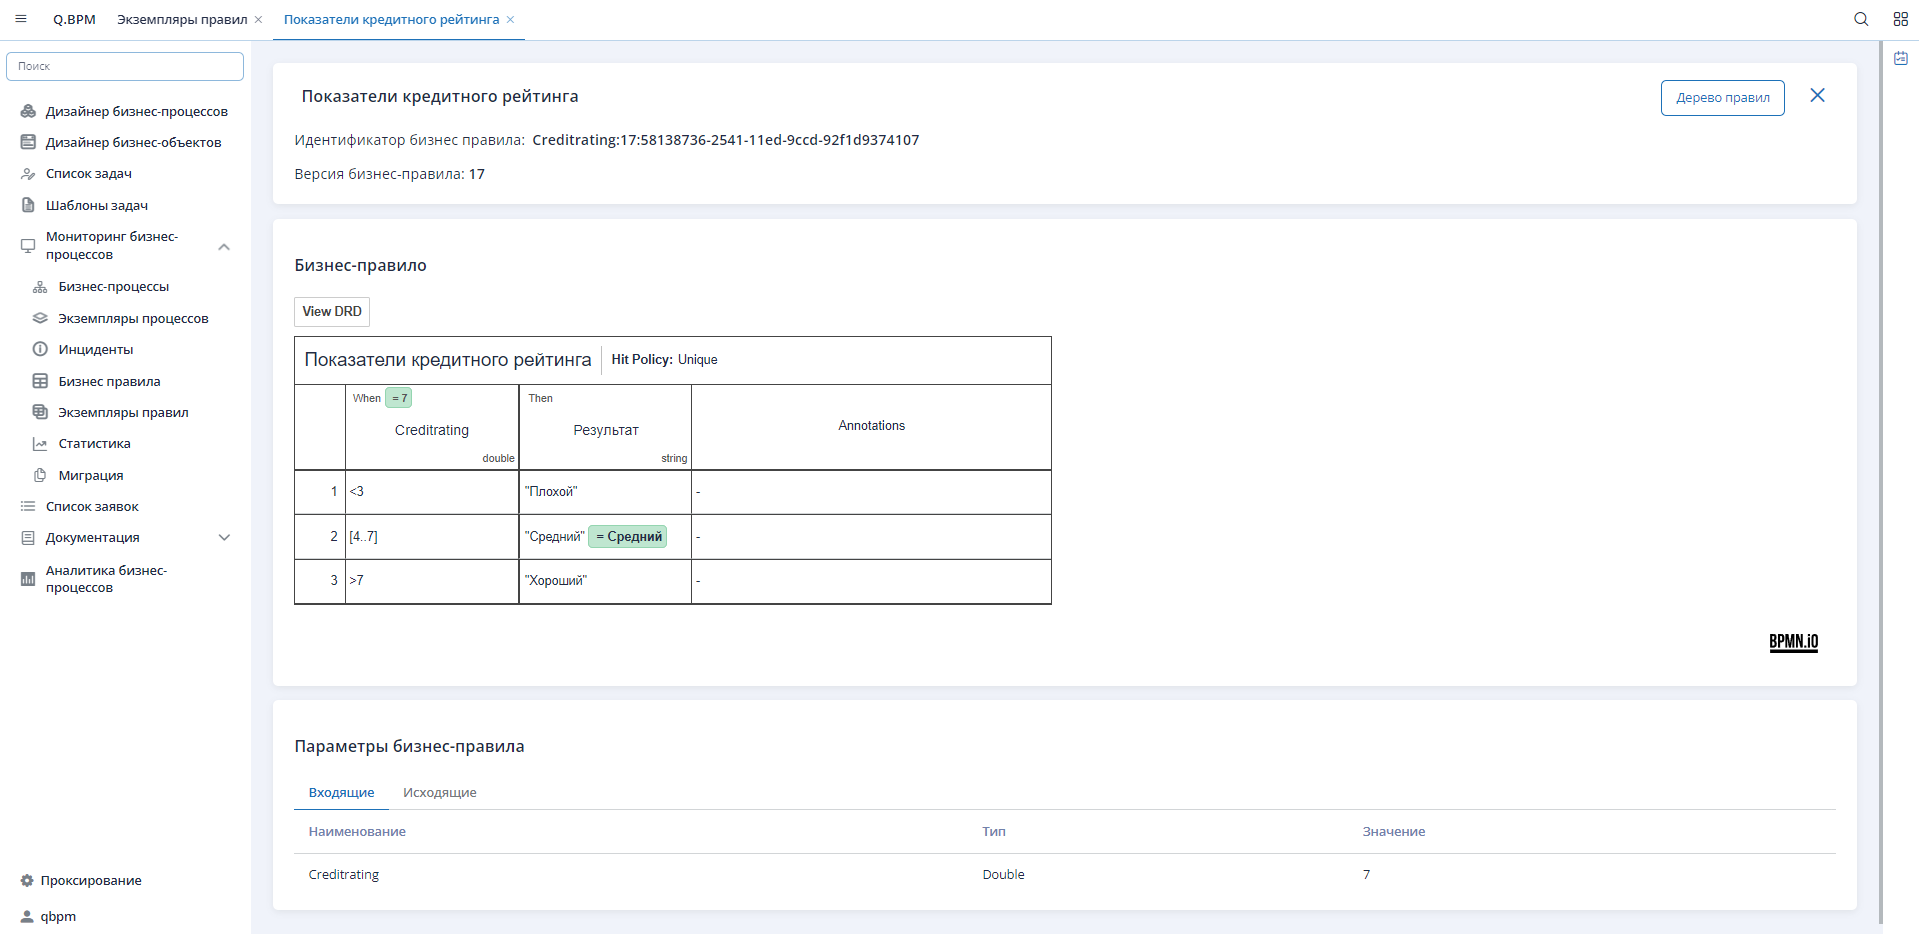
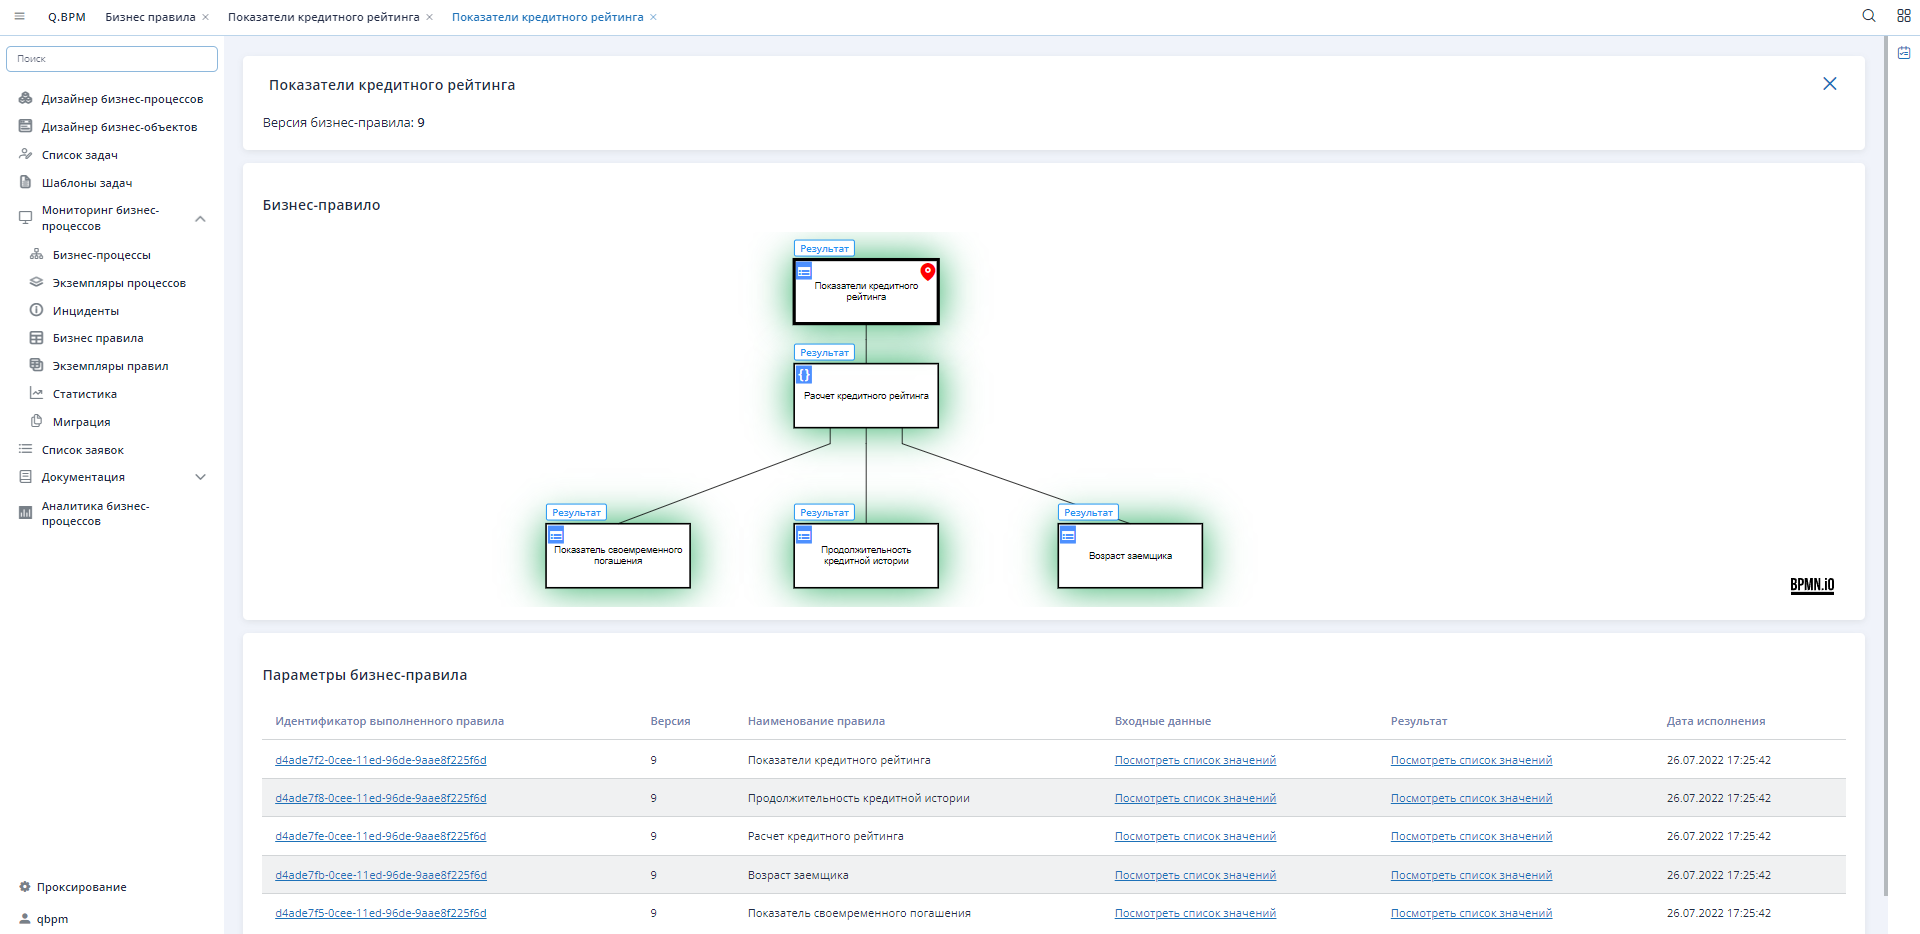
You can navigate to the decision tree view from this form. On this form, rules that have been executed are highlighted in green (the top rule in the tree is the main one, and the others are dependent). Executed rules have the same version as the "main" rule that was launched.
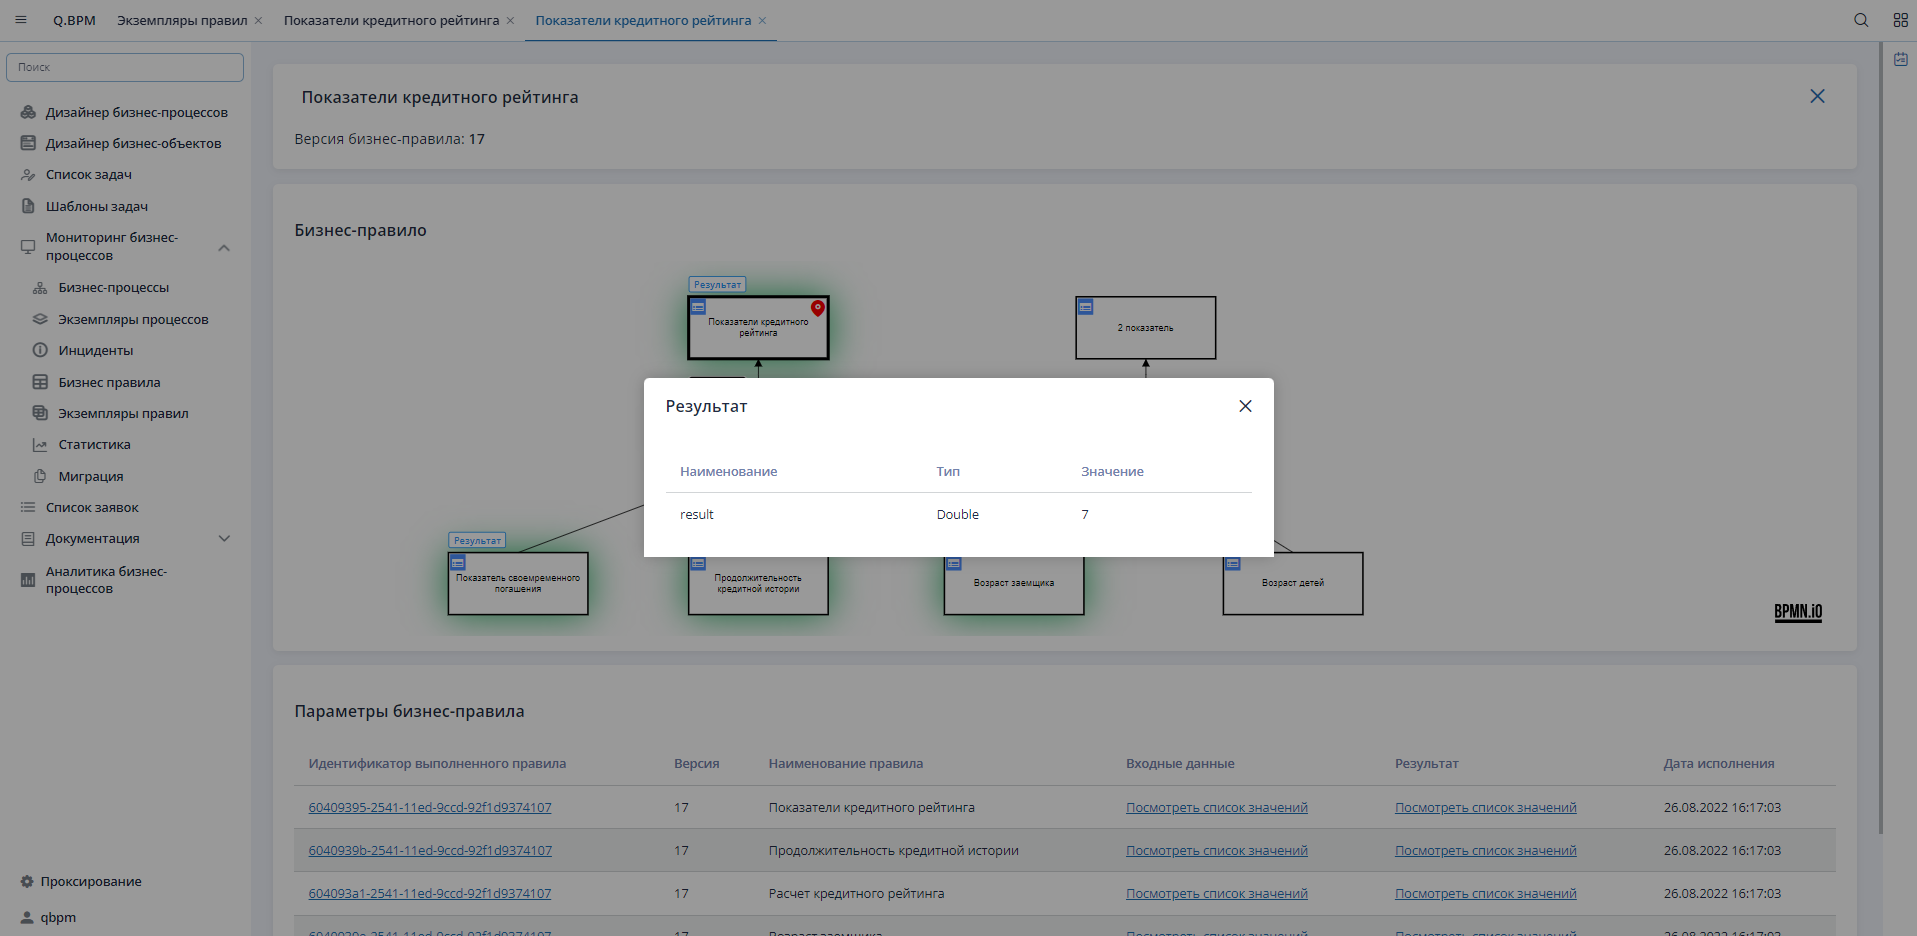
Above each rule in the tree, there is a "Result" button that opens a modal window with the result of the rule instance execution.
At the bottom of the form, there is a table with a list of instances of business rules in the decision tree (main and dependent). The list provides the following options:
- Go to the executed instance of the business rule version;
- Open a modal window to view incoming parameters and their values;
- Open a modal window to view outgoing parameters and their values.
Incidents
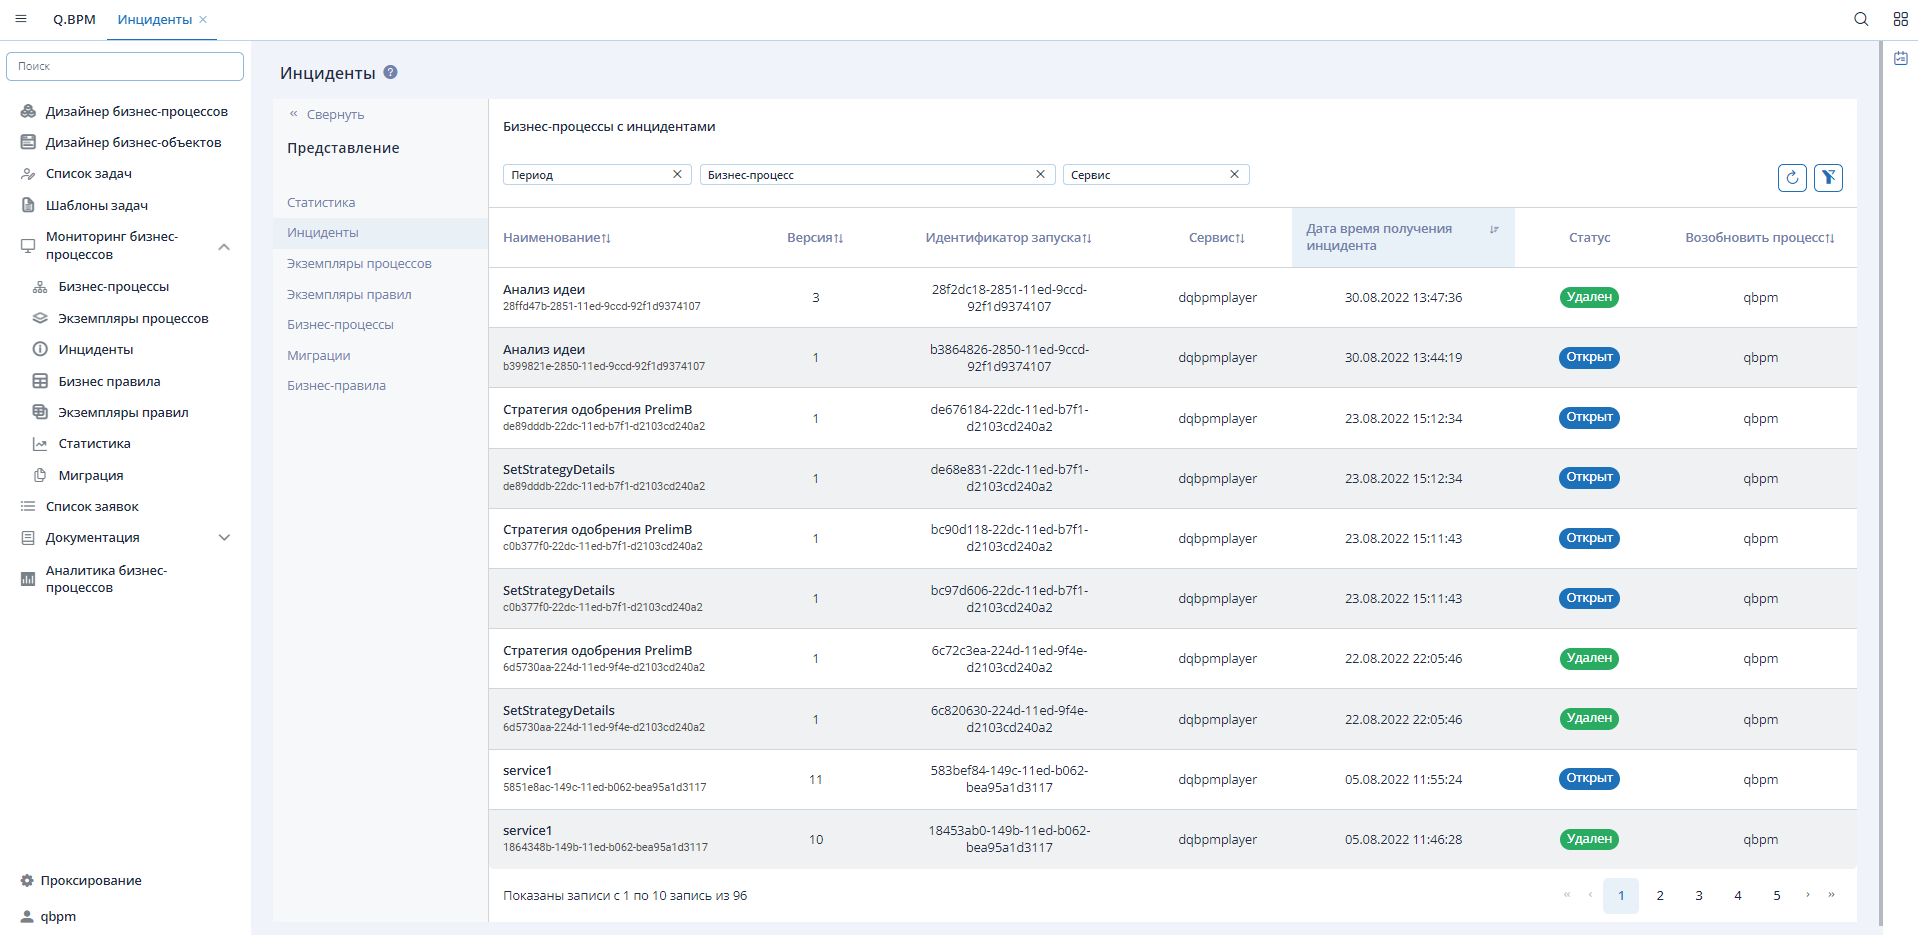
Incidents are errors that occur during the execution of a process instance. When a problem arises during the process execution, the system automatically attempts to retry the step (3 times). If the problem persists after the maximum attempt, the system creates an incident.
The list of incidents can be seen in the corresponding section of Process Monitoring. The list can be filtered and sorted. Incidents have the following statuses: Open, Removed, Completed. When an incident is opened, it transitions to a form displaying detailed information about the execution progress of the business process instance.
Statistics
The statistics interface displays statistical information about the quality and speed of executing business processes. The form presents the following statistical information:
- Number of executable business processes
- Number of executed business processes
- Number of business processes in the "In Progress" status
- Number of business processes with incidents
- List of business process instances with information about the duration of execution and deviations from the execution norm.
The list of execution duration of business process instances allows identifying "slow" processes and optimizing their execution. Clicking on a process instance in the list takes you to a form for viewing detailed information about the execution progress of the business process instance. This form enables identifying weak points in the process and improving them.
Migration
Migration is the transfer of changes from one version of the diagram to another. The migration process consists of 5 stages:
- Identification of mappings between the source version of the business process and the target version of the business process. Mapped steps on the diagrams are marked where a match is found based on the system name.
- Variable Installation Stage - adding new variables to the target process if necessary.
- Process Instances - you can select specific instances for which migration is required or uncheck the "All Active Instances" checkbox.
- Confirmation Stage - a summary of the migrated processes is displayed, options are proposed for selection, and the migration plan is displayed - what will be migrated to the target version of the business process. If the plan is successfully created, you can proceed to the last stage; otherwise, migration is not possible.
- The final stage "Result" where information about successful migration is displayed or a description of the error in case of failure.
Metrics
The process monitoring service implements metrics for Prometheus available under the resource host:port/qbpmcockpit/actuator/prometheus. All data is taken from the history of process execution. If historicity is turned off, then there will be no data on such processes.- q_bpm_process_history_incident_open_count Отображает количество открытых инцедентов
- q_bpm_process_history_incident_open_count - Displays the number of open incidents
- q_bpm_process_history_active_count - Displays the number of active business process instances
- q_bpm_activity_history_receive_task_unfinished_count - Displays the number of pending nodes waiting for messages from external systems or processes (Receive Task)